
Woo Analytics With Power BI
Integrate WooCommerce with Power BI in just a few steps! Our plugin provides a report template along with clear setup instructions to help you make data-driven decisions effortlessly.
WooCommerce provides powerful tools to create, manage, and scale your online store seamlessly for WordPress.
Power BI is a robust analytics platform from Microsoft that transforms data into actionable insights, driving smarter decisions across your organization.
How it works
Get your WooCommerce data into Power BI in just three easy steps.

Download the Plugin
Integrate your WooCommerce store with Power BI by downloading our plugin. It simplifies the process of syncing your WooCommerce data for in-depth analysis.

Set Up Power BI
Unlock the power of data analytics by connecting your WooCommerce data to Power BI. Configure the plugin to load your data, and explore advanced dashboards and reports designed for useful insights.

Instant Analytics
Our templates make it simple to start analyzing your WooCommerce data instantly, with dynamic filtering and customize report colors to match your brand.
Dynamic Filtering for Seamless Insights
Our Power BI template is designed to provide unparalleled flexibility in analyzing your WooCommerce data. With dynamic filtering options, you can focus on the metrics that matter most to your business. Here’s how you can refine your dashboards effortlessly:
Date Range
Analyze sales and trends for specific time periods with options like Last Month, This Month, This Week, Last Week, or customize your date range.
Customer Regions
Identify high-performing regions by filtering insights to see which areas have the most customers.
Products
Explore product performance by filtering for items with the highest sales or identifying those with the lowest sales.
Orders Status
Track and analyze orders based on their current status, such as Pending, Processing, Completed, or Cancelled. This helps you to understand the customer purchase behaviors.
Shipping Methods
Evaluate shipping efficiencies by filtering data based on delivery methods and understand their impact.
These intuitive filters ensure a personalized and targeted data exploration experience, helping you make data-driven decisions with ease.

Comprehensive WooCommerce Store Performance Visuals
- Daily Insight
- Monthly Metrics
- Quarterly Sales
- Buyer Segmentation
- Order Tracking
- Top Spenders
- Best Products
- Leading Regions
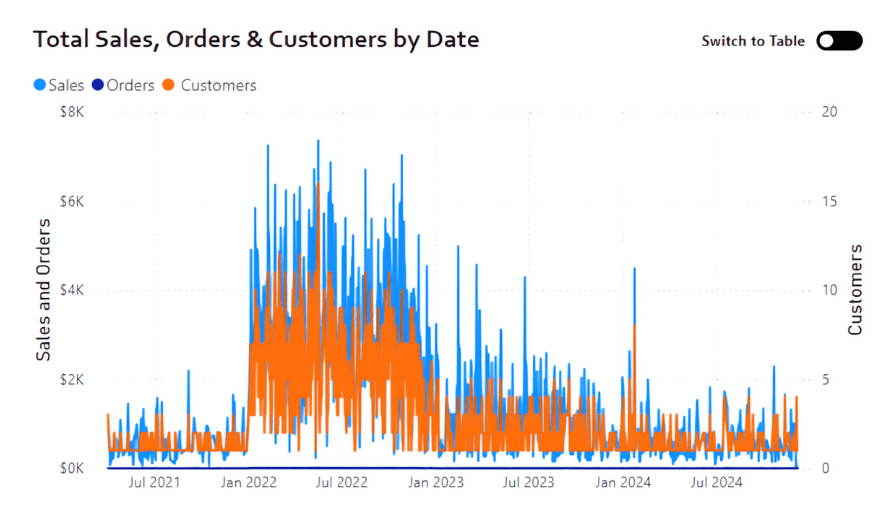
Daily Sales Performance
This graph highlights daily performance across Sales, Orders, and Customers numbers.
- Sales: The total revenue on specific dates.
- Orders: Total number of orders placed each day.
- Customers: Number of unique customers on a given date.
It helps identify peak sales days and activity on specific dates.
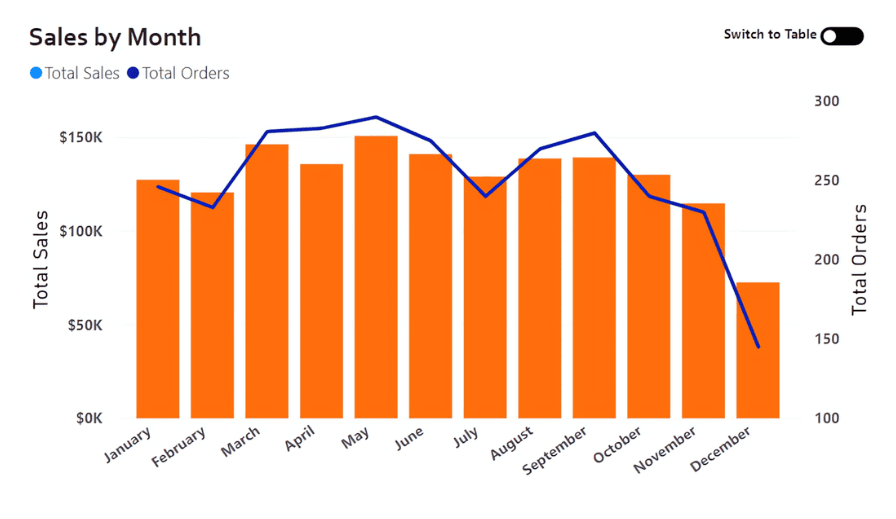
Monthly Sales Performance
This bar chart shows sales and order performance by month.
- Sales: Revenue generated for each month.
- Orders: Number of orders placed per month.
It helps analyze seasonal trends and identify the best and worst-performing months.
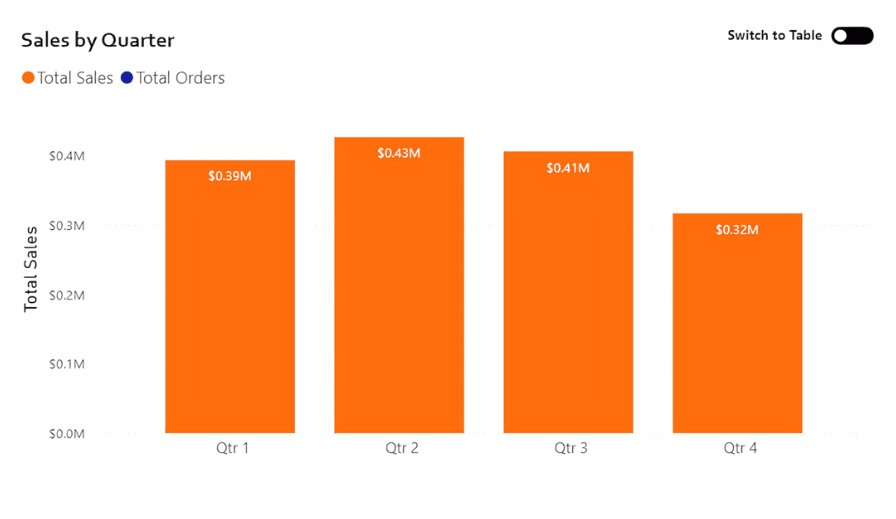
Quarterly Revenue Overview
This chart summarizes sales performance by quarter.
- Each bar represents total revenue for a quarter (Q1, Q2, Q3, Q4).
This overview helps compare sales performance across quarters and spot growth patterns.
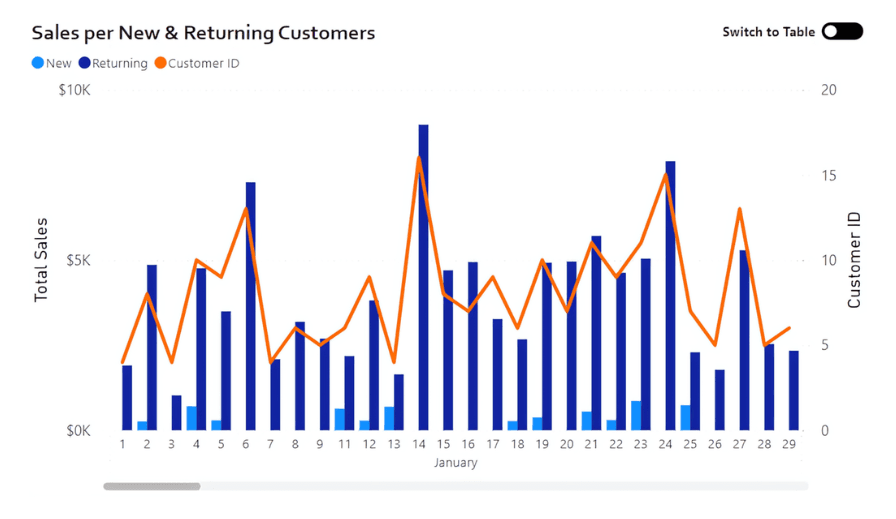
Daily New v/s Returning Customers
This graph compares sales from new customers versus returning customers.
- Returning Customers: Sales from returning customers.
- New Customers: Sales from new customers.
- Customer ID: Indicates how customers contribute to total sales.
This comparison highlights customer retention and acquisition trends over time.
Order Status Analysis
This donut chart categorizes orders based on their status.
- Processing: Orders currently being fulfilled.
- Pending: Orders awaiting action.
- Completed: Orders successfully completed.
- Cancelled: Orders cancelled for various reasons.
It helps track and analyze order activity across different statuses.
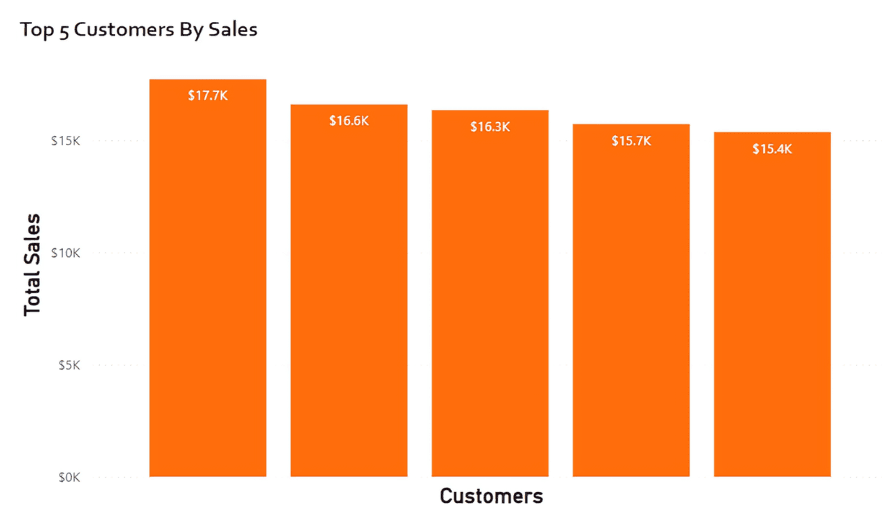
Highest-Spending Customers
This bar chart displays the Top 5 Customers by Sales.
- It shows the highest-spending customers and their total purchase amounts.
Identifying top customers can help with VIP programs or targeted promotions.
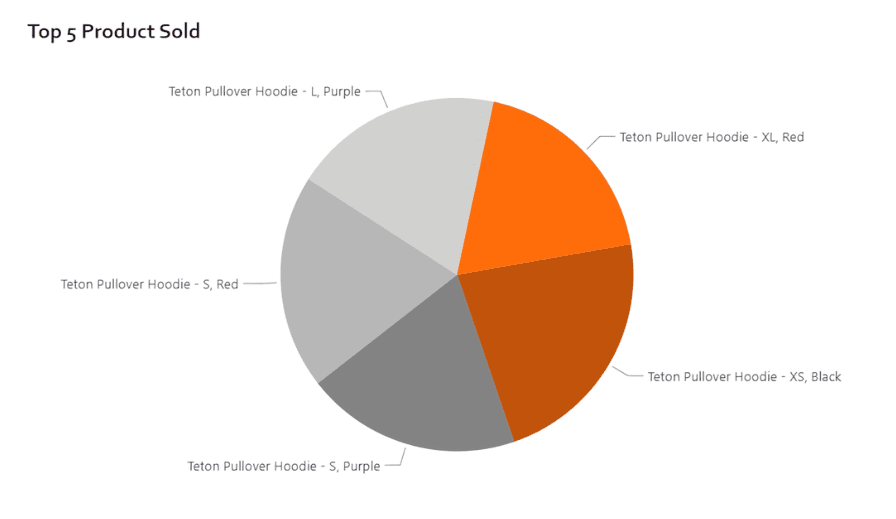
Best-Selling Products
The chart highlights the 5 most popular products contributing significantly to total revenue. Each product is ranked based on its sales performance, showcasing its percentage share of the total revenue. This data is invaluable for identifying high-demand items, enabling businesses to prioritize inventory management, ensure stock availability, and avoid potential stockouts.
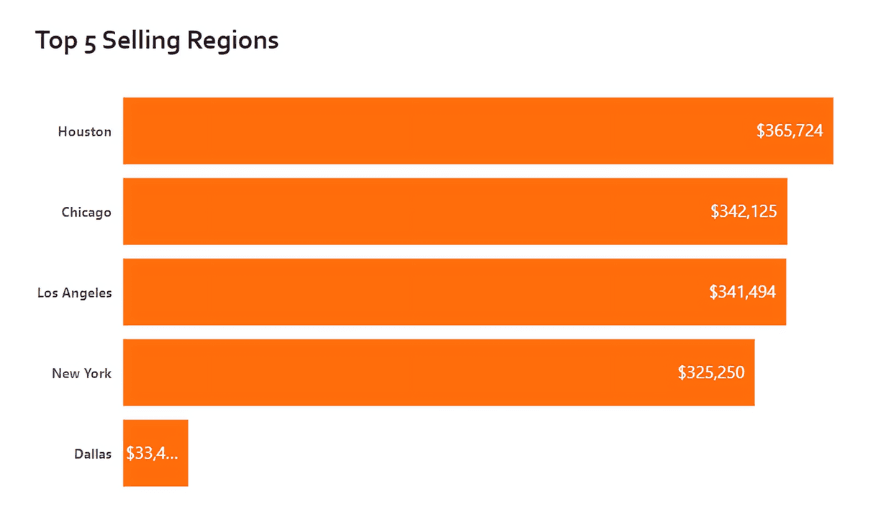
Best 5 Selling Locations
This bar chart ranks the Top 5 Selling Regions by revenue, showcasing their contribution to total sales. It shows regions with the highest sales performance, allowing businesses to focus on areas driving the most revenue.
Frequently Asked Questions
Why should I integrate WooCommerce with Power BI?
Integrating WooCommerce with Power BI allows you to visualize, analyze, and gain insights from your store’s data. This helps you make data-driven decisions to optimize sales, inventory, and customer experience.
Do I need technical expertise to set it up?
Not at all! Our step-by-step guide makes the process straightforward, even for those with limited technical knowledge. We’ve ensured the setup is user-friendly and intuitive.
What is Woo Analytics, and why do I need it?
Woo Analytics is a premium plugin designed to bridge WooCommerce with Power BI. It provides a Power BI report template and lets you personalize your reports with custom names, logos, and theme colors. This simplifies data visualization and ensures the reports align with your brand.
Is the Woo Analytics plugin free or available as a trial?
No, Woo Analytics is a premium plugin. It requires a one-year subscription, giving you access to get Power BI report templates and lets you personalize your reports with custom names, logos, and theme colors.
Can I use Woo Analytics without Power BI?
No, the plugin is specifically designed to integrate WooCommerce with Power BI. Power BI is required to visualize and analyze your store’s data.
Is my data secure when integrating Power BI with WooCommerce?
Yes, The integration uses secure API connections with encrypted keys. Power BI also ensures a secure environment for handling and visualizing your store data.
What happens if I change my store’s API keys?
If you regenerate your API keys, you’ll need to update them in the Power BI parameters to maintain the integration.
How often can I refresh the data in Power BI?
With Power BI Desktop, you can manually refresh your reports at any time. Power BI Pro users can schedule automatic data refresh intervals.
Can I share my Power BI reports with my team?
Yes! Power BI allows you to share reports with other team members, enabling collaboration and collective decision-making.
What if I don’t renew my Woo Analytics subscription?
If your subscription expires, you’ll lose access to the plugin’s advanced features, including report customization and data syncing.
Buy and Unlock Advanced WooCommerce Analytics with Power BI Integration
Building custom dashboards & reports that connect with live WooCommerce data has never been easier. Download the Woo Analytics plugin for WooCommerce now, and get connected.
Get Started in Minutes with Comprehensive Insights
Streamline Insights
Simplify your analytics journey with our template design.

Total sales, Refund orders, Shipping tax and much more.
28 metrics
79 dimensions
Deliver useful insights for smarter decision-making with data-driven precision.
Switch
Quickly flip between table and graph views.
Monitor your business performance with all metrics at a glance!
